
6 Aug 2023 A new version of the Gantt Chart for SharePoint Online is available !!!
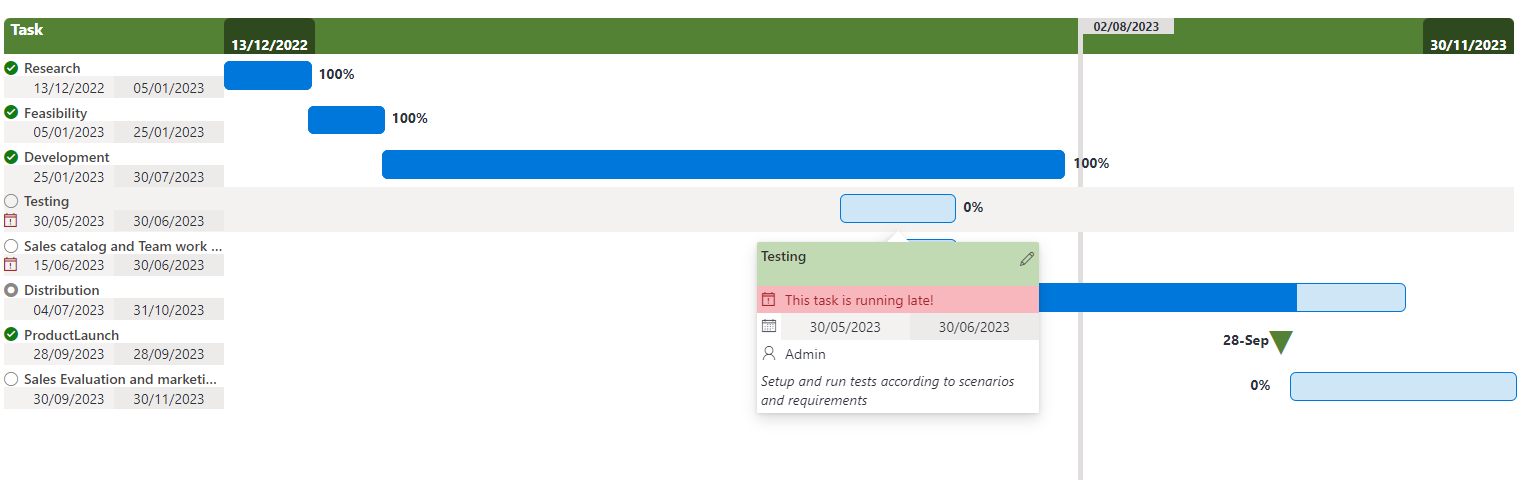
Gantt charts are very useful in projectmanagement to give the people involved a clear overview of when a task should start and finish in relation to other tasks.
Using view format in SharePoint (Online only), we can achieve this to a certain extent. Mind me, it is far from perfect and in its current version it is mainly useful for top-level views.
So what are we talking about…

Let’s get started
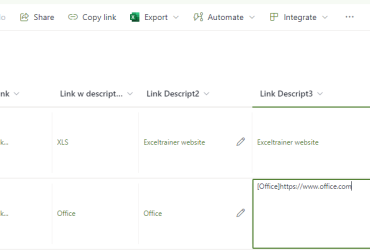
First we need a list with 4 extra columns, ProjectStart, ProjectDue, TaskStart and TaskDue. you can use different names but the script will be looking for the internal names mentioned.
Once the list is created we need to add some data. And last but not least we will have to create a view using the JSON-code.
Create a list
Create a new “blank” list from Site Contents, and add the needed date columns. obviously you can create more columns if you like, but these are the bare minimum.
20 dec 2020: Added the “Progress” column for status indicator.
| Columnname | Columntype |
|---|---|
| Title | Text |
| ProjectStart | Date and time |
| ProjectDue | Date and time |
| TaskStart | Date and time |
| TaskDue | Date and time |
| Progress | Number (min: 0, max:100, percentage) |

Please note that whenever you create a column an internal name is assigned to this column. If you change the name of a column, you do not change the internal name. So make sure you use the correct name straight away.
Create a new view
In the future you are still going to need the default view “All items” to add new entries in your list. So we better create a new view.
- Click on All items
![[1]](https://exceltrainer.be/wp-content/uploads/2020/08/1_one.png)
- Choose Save view as
![[2]](https://exceltrainer.be/wp-content/uploads/2020/08/2_two.png)
- In the pop-up you add a useful name
![[3]](https://exceltrainer.be/wp-content/uploads/2020/08/3_three.png) , I am using “Gantt Chart”.
, I am using “Gantt Chart”. - Click on Save
![[4]](https://exceltrainer.be/wp-content/uploads/2020/08/4_four.png)

Apply the View formatting
- Click on All items
- Choose Format current view to open the Format view-pane.

- Click on Advanced mode
- Go to the code on this page
- Click on the
 -button to copy the code
 - Return to your SharePoint page.
- Paste the code (using <CTRL>+<V>) in the Format view-pane .
- To test, click on Preview
![[5]](https://exceltrainer.be/wp-content/uploads/2020/08/5_five.png) .
. - And if everything works out fine just click on Save
![[6]](https://exceltrainer.be/wp-content/uploads/2020/08/6_six.png) .
.

The Gantt-chart JSON-script
6 nov 2020: Updated to include a marker for the current date
20 dec 2020: Updated to include a header, status indicator and fix for TaskDue after ProjectDue
23 dec 2020: Updated to include indicators and background color
<div class="wp-block-codemirror-blocks-code-block alignwide code-block"><pre>{
"schema": "https://developer.microsoft.com/json-schemas/sp/view-formatting.schema.json",
"hideSelection": true,
"hideColumnHeader": true,
"rowFormatter": {
"elmType": "div",
"style": {
"height": "=if(@rowIndex == 0, '7em', '4em')",
"display" : "block",
"width" : "100%%"
},
"children": [
{
"elmType" : "div",
"attributes" : {
"class" : "ms-bgColor-gray20"
},
"style" : {
"width" : "100%%",
"display": "=if(@rowIndex == 0, 'flex', 'none')",
"height" : "3em"
},
"children" : [
{
"elmType" : "div",
"txtContent" : "Taskname",
"style" : {
"width" : "220px",
"text-align" : "left",
"padding-left" : "0.4em",
"font-weight" : "bold",
"box-sizing": "border-box"
},
"attributes": {
"class" : "ms-fontSize-16"
}
},
{
"elmType" : "div",
"style": {
"flex-grow": "1",
"height": "3em",
"font-weight" : "bold"
},
"attributes": {
"class" : "ms-fontSize-14"
},
"children" : [
{
"elmType" : "span",
"txtContent": "=toLocaleDateString([$ProjectStart])",
"style" : {
"position": "relative",
"left" :"0"
}
},
{
"elmType" : "span",
"txtContent": "=toLocaleDateString([$ProjectDue])",
"style" : {
"position": "absolute",
"right" :"0"
}
}
,
{
"elmType" : "span",
"txtContent" : "=toLocaleDateString( @now)",
"style" : {
"position": "relative",
"width": "100px",
"font-size":"1em",
"z-index" : "100",
"display" : "=if( [$ProjectDue] < @now , 'none', 'block')",
"left": "= floor( (Number(@now)-Number([$ProjectStart])) / (Number([$ProjectDue])-Number([$ProjectStart])) * 100 ) + '%%' "
}
}
]
}
]
},
{
"elmType" : "div",
"style" : {
"width" : "100%%",
"display": "flex"
},
"children": [
{
"elmType" : "span",
"style" : {
"width": "20px",
"padding-top" : "0.4em",
"color" : "=if( [$Progress] == 1, '#107c10' ,if( [$TaskDue] > [$ProjectDue] ,'#a80000', if( [$TaskStart]> @now, '#d0d4d8', if( [$TaskDue]< @now, '#a80000', '#699DE0') ) ) )"
},
"attributes" : {
"iconName" : "=if( [$Progress] == 1, 'CompletedSolid' ,if( [$TaskDue] > [$ProjectDue] ,'WarningSolid', if( [$TaskStart]> @now, 'Calendar', if( [$TaskDue]< @now, 'AlarmClock', 'CircleRing') ) ) )",
"title": "[$Progress]",
"class" : "ms-fontSize-16"
}
},
{
"elmType": "button",
"txtContent": "[$Title]",
"customRowAction": {
"action": "editProps"
},
"style": {
"width": "200px",
"max-height" : "2em",
"padding" : "0",
"border": "none",
"background-color": "transparent",
"cursor": "pointer",
"text-decoration": "none",
"text-align": "left",
"outline": "none",
"display" : "inline-block",
"overflow" :"hidden",
"text-overflow" : "ellipsis"
},
"attributes": {
"title": "[$Title]",
"class": "ms-fontSize-16 ms-fontColor-themePrimary ms-fontColor-themeDarker--hover"
}
},
{
"elmType": "div",
"style": {
"flex-grow": "1",
"position": "relative",
"height": "3em",
"border-style": "dotted",
"border-width": "1px 0 1px 0"
},
"attributes": {
"class": "ms-borderColor-neutralTertiary"
},
"children": [
{
"elmType": "div",
"txtContent": "=toLocaleDateString([$TaskStart]) + ' - ' + toLocaleDateString([$TaskDue])",
"style": {
"position": "relative",
"box-sizing": "border-box",
"display": "flex",
"border-radius": "1em",
"z-index" : "1",
"top" : "0.2em",
"height": "2.6em",
"overflow" : "hidden",
"text-overflow" : "ellipsis",
"padding" : "0 0.2em 0 0.4em",
"border": "1px solid",
"border-color" : "=if( [$Progress] == 1, '#107c10' ,if( [$TaskDue] > [$ProjectDue] ,'#a80000', if( [$TaskStart]> @now, '#d0d4d8', if( [$TaskDue]< @now, '#a80000', '#699de0') ) ) )",
"background-color" : "=if( [$Progress] == 1, '#bed6be' ,if( [$TaskDue] > [$ProjectDue] ,'#d6b3b3', if( [$TaskStart]> @now, '#dbe2ea', if( [$TaskDue]< @now, '#d6b3b3', '#c7d5e7') ) ) )",
"left": "= (Number([$TaskStart])-Number([$ProjectStart])) / (Number([$ProjectDue])-Number([$ProjectStart])) * 100 + '%%'",
"width": "= if( [$TaskDue] > [$ProjectDue], (Number([$ProjectDue])-Number([$TaskStart])+ 86400000) / (Number([$ProjectDue])-Number([$ProjectStart])+ 86400000) * 100 , (Number([$TaskDue])-Number([$TaskStart])+ 86400000) / (Number([$ProjectDue])-Number([$ProjectStart])+ 86400000) * 100 ) + '%%'"
},
"attributes": {
"title": "=[$Title] + ' - ' + toLocaleDateString([$TaskStart]) + ' - ' + toLocaleDateString([$TaskDue])"
}
},
{
"elmType" : "span",
"txtContent" : "",
"attributes" : {
"title" : "=toLocaleDateString( @now)",
"class" : "ms-fontColor-gray40"
},
"style" : {
"position": "relative",
"display" : "=if( [$ProjectDue] < @now , 'none', 'block')",
"top" : "-2.6em",
"z-index" : "100",
"border-left" : "5px solid",
"height": "3em",
"width" : "1em",
"left": "= (Number(@now)-Number([$ProjectStart])) / (Number([$ProjectDue])-Number([$ProjectStart])) * 100 + '%%' "
}
}
]
}
]
}
]
}
}
Great! Thank you for sharing your expertise! Just wondering if there is a way to allow +/- of time span, just like what Microsoft Project can do?
Hi Toshi Iwata,
As it stands this is not really possible.
The only way to get something closely to that is to apply grouping to the view.
So that means adding additional columns to identify the parent task and to group by this additional column. But I think you really need to rewrite the script itself to get this.
Geert
Hi Geert,
thank you for that great piece of json formatting code! I was just wondering, if it is possible to add some more columns before the gantt is to be displayed.
In which section of the code do I have to enter the code?
Thank you in advance:-)
Hi Victoria,
If you want to add more columns, you need to start reading from line 100.
Adding more columns isn’t going to be easy, so the easiest thing to do is to change
"txtContent": "[$Title]",into
"txtContent": "=[$Title]+' '+[$NewColumn]",If you really want to do more, it is basically that area the needs to be converted to a div with multiple children.
Make sure to check Federico’s version on Linkedid
Hope this helps
Geert
Hi! very useful tool! I’m really impressed!
Can the Sharepoint list be connected to an Excel-sheet?
I have one time line established (for Think-Cell in Powerpoint) and I don’t want to timelines to be maintained.
Hi Maiken
No, unfortunately not.
SharePoint only allows you to import the Excel but you can’t make the list update itself whenever there is new data in Excel.
Unless maybe with Power Automate… But I haven’t done that myself yet.
Geert
How would I remove the project start data and end date? Essentially need to use only two dates. Taking data from a team tracker so all line items will be seperate task.
Can this be setup to only use two dates instead of 4?
Essentially need to remove the task date logic and keep everything on the same 12 month calendar.
Hi Harb,
To my Knowledge it is not possible to do this with less columns.
(I would have of course)
Fact is that every row only look at the data contained in that row itself and it can not see data from other rows.
Edit:
But if you need to see the same date everywhere you can either have a default value for these 2 columns, so you don’t need to fill it yourself.
Kind regards,
Geert
Geert, thanks for posting this! I was trying to figure out how to do this, and like others I didn’t want to have the Gantt Start/End in the SharePoint list, so I did manage to get rid of the Project Start/End dates in your JSON code by replacing them using [$ProjectStart] -> @now and [$ProjectEnd] -> (@now+7948800000) where the number is the number of milliseconds you want to add.
Great suggestion.
I do see a downside to this as well, the width and the position of the bar is calculated based on the total duration between the ProjectStart and the ProjectEnd. So I don’t think you will have the correct widths.
You could create some kind of logic that it ProjectStart becomes the first day of the current year. But that will get you into trouble once the project takes more than one year to complete.
kind regards,
Geert
In order to do this, instead the field projectstart and projectand I’v used =toLocaleDateString(addDays(@now, -90)) and =toLocaleDateString(addDays(@now, +90))
In this way, when the page is loaded the gantt shows a period between today -90 days and today + 90 days. The difficult part was rewrite all formulas to calculate left position and widht position, because a task may begin before the first date or ends after the last date and other combination to show; an example:
“left”: “= if( [$DataInizio] addDays(@now, 90) ,0, (Number([$DataInizio])-Number(addDays(@now, -90))) / (Number(addDays(@now, 90))-Number(addDays(@now, -90))) * 100) + ‘%'”,
“width”: “=if( (([$DataInizio] < addDays(@now, -90) && [$DataScadenza] addDays(@now, 90)),0,if( ([$DataScadenza] < addDays(@now, 90)), if( ([$DataInizio] < addDays(@now, -90)),(Number([$DataScadenza])-Number(addDays(@now, -90))+ 86400000) / (Number(addDays(@now, 90))-Number(addDays(@now, -90))+ 86400000) * 100,(Number([$DataScadenza])-Number([$DataInizio])+ 86400000) / (Number(addDays(@now, 90))-Number(addDays(@now, -90))+ 86400000) * 100),if( ([$DataInizio] < addDays(@now, -90)),100,(Number(addDays(@now, 90))-Number([$DataInizio])+ 86400000) / (Number(addDays(@now, 90))-Number(addDays(@now, -90))+ 86400000) * 100))) + '%'"
},
If you like I can post full code. @Geert: thank you very very much for your nice code; I searched a good code for months, because I'm not able to write one myself.
Hi Marco,
I would love to see and test the whole code.
We (you) could even make it available on Github as an alternative to the default code so you can give back to the community.
Kind regards,
Geert
Unfortunately the progress bar does not seem to work.
Hi AG,
The sample is not using a progress bar as such, it only changes the colour of the task and the icon in front of the task.
Federico Sapia created a version that is showing a progress bar Gantt Chart by Federico Sapia
Since it is based on the same columns you can simply copy paste his JSON into a view.
Kind regards,
Geert
Hi Geert,
Thanks for putting your Gantt chart out here. It looks awesome. Unfortunately I can’t get the chart to work on my list.
It’s creating the correct rows but each row then has a solid light blue bar to the right. The dates are showing as “Invalid Date – Invalid Date”. However, the ProjectStart and ProjectEnd dates appear to work ok.
I’ve confirmed that my region is set to UK and the dates in the List show as dd/MM/yyyy.
Do you have any suggestions? Thanks.
All the best, Ben
Is there a way to add milestones with a marker like in SharePoint classic?
Hello Marie,
The short answer, not at this moment.
The long answer, yes I do see possibity to get this in the code.
I suppose it would be possible to create an additional column “TaskType” with the options “Normal” and “Milestone”.
Then we can test the value of this column and based on this use a different presentation, for example by replacing the bar with a large diamond-shaped icon.
I will put this on to-do list.
But I can’t give any timeframe for implementing this.
Hi @marie Raymond,
The updated version now includes Milestones.
Please check the code here: https://exceltrainer.be/sharepoint/989/
Geert
Hello,
Great content !! I want to apply this but a simpler version. I have projects listed and I only want a Gantt view to see when they start and when they end compare to each other, similar to your view, I have tried to adapt the code but without success. The date borders do not work meaning that all the projects’ time bar goes from the beginning to the end.
Any help on this issues?
Thank you again!
R.R
hi R.R.
I think I understand what you’re trying to accomplish.
To make this work you have to understand that the fields ProjectStart and ProjectEnd are there to calculate the starting point and the width of the bar.
so in your situation those dates should fulfil the role of the complete time frame you want to plot the ganttchart on. For example 01/01/2023 and 31/12/2024.
that being said it would be just a matter of swapping the columnnames that are used in the code with the internal columnnames from your list.
The internal columnnames can be seen when you go to the lists listsettings and click on one of the columns, the internal name is now visible in the address bar of your browser (all the way at the end).
hope this helps.
Geert
Hello there! Thank you for this. Wondering if there is any way to add the text of a column underneath the task title. We are trying to add the person the task is assigned to. Using this and also the template from Federico. Thanks!
Hi Shawn,
I am currently working on a new version, and this is indeed one of the options I will add.
Hopefully this will be ready by the end of coming weekend. I will publish it here and will let you know as soon as it is ready.
Geert
Hi @Shawn,
Here is the code that also includes comments.
https://exceltrainer.be/sharepoint/989/
The comments are displayed in the customcard when you hover over a bar.
Thank you! This is really going to help us get organized with our documentation and project planning. Appreciate you sharing your knowledge!
almost there…
#SharePoint #GanttChart with a cleaner format, Milestones, hovercards and progress update action
#viewformatting
I want to have this view for multiple projects in one place, so possibly using group by or any other suggestion you may have?
Hi Eva,
Grouping is not that easy because the header is linked to the first task. So when the first task is not visible, you don’t get to see the header.
It is not possible to bring the header to every group, because the header info is saved in a record and whenever you group, there is no record on the level of the group header.
That being said.
You can create multiple projects like this and then add them all to page with multiple list webpart.
Geert
Hi Geert,
Thank you so much for the sharing! That’s amazing!
Would you please share if it is possible to add lines between milestones to highlight dependencies between them? Would be great if you can share some tips/ thoughts as to how this could be achieved, thank you!
Hi A.A.,
No, this is, to my knowledge, not possible.
I think I would have added those lines already, if I had known a way to do this.
But in this view formatting, every row doesn’t have any understanding of the surrounding rows and it is therefore not possible to draw aline between them.
Sorry.
Kind regards,
Geert
Hi Greet,
Thank you for the prompt response. The view is still amazing without the dependency lines!
Thank you for sharing again 🙂
Best,
A.A.
Looks very good but kind of breaks along the way
I get this error in the JSON:
$ref ‘/properties/attributes/class’ in ‘https://developer.microsoft.com/json-schemas/sp/v2/column-formatting.schema.json’ can not be resolved.(768)
Any clue?
Hi
It seems to me you have not copied the first few characters of the code.
Could you check again?
Grt Geert