In this example I will be trying to get more out of a date column.
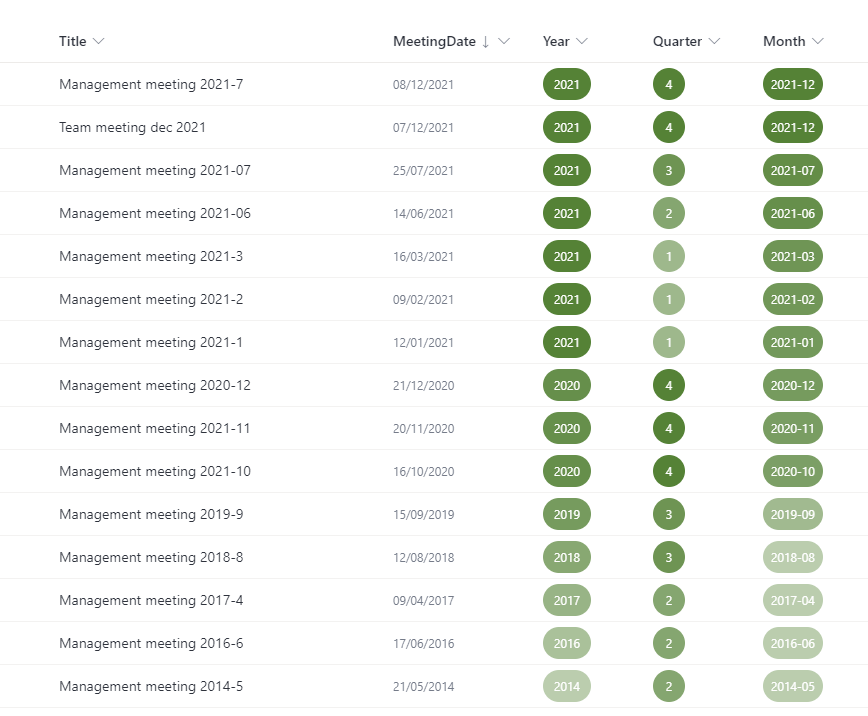
So, assuming I have a date column, how can I show years, quarters, and months. Additionally, I want to give a visual clue by changing the colour, or actually the opacity, of the background. This is based on the technique shown in the GitHub number-background-color-shading sample create by Tetsuya Kawahara (Do check Tetsuya’s site! It is packed with examples and ideas.)
To make this work I started with a normal date column and called it: MeetingDate.
Obviously, you can have any kind of column name but do keep track of its internal name. In this sample the internal name of the column MeetingDate is indeed Meetingdate too.
Next, I created three calculated columns: Year, Quarter and Month, and as you will see later, they did became a little more exotic each time.
Calculated Column: Year
To calculate the year based on any date column, I always use the TEXT-function. I personally prefer the function over the YEAR-function since the YEAR-function returns a numerical value, and a numerical value will display “2021” like “2.021” bah.
The main function is preceded by an IF to test if the MeetingDate is empty.
- The function
- Tell me how
=IF(MeetingDate="","",TEXT(MeetingDate,"YYYY"))

or

=IF(MeetingDate="";"";TEXT(MeetingDate;"YYYY"))
- Click on Add column in the library or list and choose More…
- Enter the name of the column, for example: “Year” .
- As a type select Calculated (calculation based on other columns).
The screen will refresh and allow you to add the function a bit lower - Enter the function “=IF(MeetingDate=””,””,TEXT(MeetingDate,”YYYY”))”
Replace “MeetingDate” with the name of your column which contains the original date. - Leave the return type on “Single line of text”
- Click on OK.
Just a few notes about functions in SharePoint and Regional settings:
- If you use SharePoint in another language, you can still use any English-function, so IF and TEXT are valid functions in any language.
After saving the column and returning to the column settings, SharePoint will have translated the functions to the language in which you use SharePoint. - Depending on your regional and language settings, you either have to separate the different arguments with a comma (,) or a semi-colon (;).
Using the wrong separators, will return an error message when you try to save your changes. Plus, any changes that were made, will be lost whenever such an error is returned. - The “YYYY” indicates how the date needs to be returned, in this specific situation: the year with 4 characters.
Date display options with TEXT
| “MeetingDate” value | Function in Calculated column | Result |
|---|---|---|
| December 8, 2021 | TEXT(MeetingDate,”YYYY”) | 2021 |
| December 8, 2021 | TEXT(MeetingDate,”YY”) | 21 |
| January 8, 2022 | TEXT(MeetingDate,”MMMM”) | January * |
| January 8, 2022 | TEXT(MeetingDate,”MMM”) | Jan * |
| January 8, 2022 | TEXT(MeetingDate,”MM”) | 01 |
| January 8, 2022 | TEXT(MeetingDate,”M”) | 1 |
| January 8, 2022 | TEXT(MeetingDate,”DDDD”) | Saturday |
| … etc … | … etc … | … etc … |
* Please note that “January” and “Jan” will be translated based on the language setting of the SharePoint site.
A little beyond the scope of this example, but the TEXT function can also be used to show:
- Times using this kind of format: “H:MM AM/PM”
- Percentages using the format: “0.00%”
Year Column format
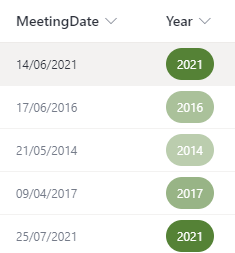
The the columnformat displayed below, changes the background colour (or the opacity) of every year compared to the current year.
The value “10” in the opacity-line indicates how many colour levels will be created. In other words, the value 10 (yes, you have to repeat it 4 times in the formula), will decrease the opacity with 10% each year starting with 100% for the current year. So, the current year will have an opacity of 100%, last year will have an opacity of 90% etc…
Obviously, you don’t want the opacity to be small since at that point the background colour, being 0% or even less, will no longer show at all. I therefore decided to have a minimum of 40% (0.4).
Decide for yourself which values work best.
{
  "$schema": "https://developer.microsoft.com/json-schemas/sp/v2/column-formatting.schema.json",
  "elmType": "div",
  "children": [
    {
      "elmType": "div",
      "style": {
        "width": "48px",
        "height": "32px",
        "border-radius": "16px",
        "fill": "currentColor",
        "display" : "=if (@currentField == '' , 'none', 'flex')",
        "overflow": "hidden",
        "justify-content": "center",
        "align-items": "center",
        "opacity": "=if((@currentField-getYear(@now)+10)/10 < 0.4 ,0.4,(@currentField-getYear(@now)+10)/10)"

      },
      "attributes": {
        "class": "ms-bgColor-themePrimary ms-fontColor-white"
      },
      "children": [
        {
          "elmType": "div",
          "txtContent": "@currentField"
        }
      ]
    }
  ]
}
One extra comment here:
The JSON does NOT use different separators according to your regional settings.
So don’t replace the dots and the commas in “0.4,0.4,“.
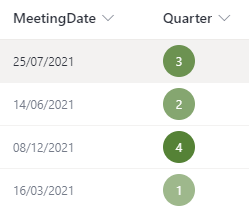
Calculated column: Quarter
I will use the same kind of technique on the quarters, but this time I only want 4 different values for the quarters, so that will make the JSON a lot easier. On the other hand, there is no actual function to calculate the quarter of any value. Probably because the quarter can easily be derived from the month number.
After starting to check if the MeetingDate is empty or not, the main idea is that we first divide the month number by 3 (because there are 3 months in a quarter 😉) followed by a roundup with 0 decimals.
=IF(MeetingDate="","",ROUNDUP(MONTH(MeetingDate)/3,0))

or

=IF(MeetingDate="";"";ROUNDUP(MONTH(MeetingDate)/3;0))
In the sample above “MeetingDate” is still the internal name of the SharePoint column, and you still need to use the commas (,) or semi-columns (;) version depending on your regional settings.
Basic quarter column format
{
    "$schema": "https://developer.microsoft.com/json-schemas/sp/v2/column-formatting.schema.json",
    "elmType": "div",
    "children": [
      {
        "elmType": "div",
        "style": {
          "width": "32px",
          "height": "32px",
          "border-radius": "16px",
          "fill": "currentColor",
          "display" : "=if (@currentField == '' , 'none', 'flex')",
          "overflow": "hidden",
          "justify-content": "center",
          "align-items": "center",
          "opacity": "=@currentField/4"
        },
        "attributes": {
          "class": "ms-bgColor-themePrimary ms-fontColor-white"
        },
        "children": [
          {
            "elmType": "div",
            "txtContent": "@currentField"
          }
        ]
      }
    ]
  }
Improving the visibility
This above JSON will create opacities 100% (Q4), 75% (Q3), 50% (Q2) and 25% (Q1).
I personally think that the opacity for Q1 is a little on the low side, so instead of dropping the quarters with 25%, I rather have opacities dropping with for example 12.5%. To do so, I can change the formula to for the opacity from @currentField/4 to (Number(@currentField)+3)/7.
Interesting to see here is that dividing by 4 can easily be done, but when I add 3 first before I divide by 7, I deliberately have to indicate that the currentField is a Number.
{
"$schema": "https://developer.microsoft.com/json-schemas/sp/v2/column-formatting.schema.json",
"elmType": "div",
"children": [
{
"elmType": "div",
"style": {
"width": "32px",
"height": "32px",
"border-radius": "16px",
"fill": "currentColor",
"display" : "=if (@currentField == '' , 'none', 'flex')",
"overflow": "hidden",
"justify-content": "center",
"align-items": "center",
"opacity": "=(Number(@currentField)+3)/7"
},
"attributes": {
"class": "ms-bgColor-themePrimary ms-fontColor-white"
},
"children": [
{
"elmType": "div",
"txtContent": "@currentField"
}
]
}
]
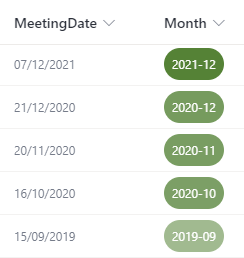
}Calculated column: Month
In this last sample I am again taking a slightly different take on both the function and the format. This time I want to display both the year and the month like for example “2021-12”.
The calculated column isn’t incredibly special by itself:
=IF(MeetingDate="","",TEXT(MeetingDate,"YYYY-MM"))

or

=IF(MeetingDate="";"";TEXT(MeetingDate;"YYYY-MM"))
Column format for YYYY-MM
The format here is a bit of a challenge. I want the background to change for every month, so we need to give every month a decreasing relative number starting from the current month.
That raised the question how many different values/backgrounds I wanted. If I would have too many, I don’t see the difference for the first years. If I would have too less, I am running out of backgrounds too fast.
First I started by deciding how many possibilities I wanted based on the number of years I wanted to go back in time.
So let’s decide to show a maximum of 5 years, that means I have 5*12 = 60 months maximum, and I will rewrite that into 4*12+12 months. The reason for rewriting this is because this allows me to adapt the formula afterwards easily. Just wait.
Since the calculated column is generating an output that looks like this 2020-11, and I needed to turn this in a relative month where the current month is always my maximum 60.
To get this, I performed the following actions:
- Extract the year from the calculated column
Which can be done using the substring-function: “substring(@currentField,0,4)“. - Calculate and substract the current year :
For this I used the getYear-function: “getYear(@now)“. - And add 4 to this value. The 4 is indeed the same 4 as used in the 4*12+12.
- Since I am not interested in the number of years, but in the number of months, I will multiply the relative year number with 12.
- Just to finish this I am adding the number of months using the same substring-function: “Number(substring(@currentField,5,7))“
The relative month number-function, will thus look like this: Number( (substring(@currentField,0,4)-getYear(@now)+4)*12+Number(substring(@currentField,5,7))) - To turn this into a percentage having the current month being 100%, I will divide this by the previously created maximum: 4*12+12
{
  "$schema": "https://developer.microsoft.com/json-schemas/sp/v2/column-formatting.schema.json",
  "elmType": "div",
  "children": [
    {
      "elmType": "div",
      "style": {
        "height": "32px",
        "border-radius": "16px",
        "fill": "currentColor",
        "display": "=if (@currentField == '' , 'none', 'flex')",
        "overflow": "hidden",
        "padding": "0 8px",
        "justify-content": "center",
        "align-items": "center",
        "opacity": "= Number( (substring(@currentField,0,4)-getYear(@now)+4)*12+Number(substring(@currentField,5,7))) / (4*12+12)"
      },
      "attributes": {
        "class": "ms-bgColor-themePrimary ms-fontColor-white"
      },
      "children": [
        {
          "elmType": "div",
          "txtContent": "@currentField"
        }
      ]
    }
  ]
}
Like with the first example, I don’t want the opacity to go below 0.4 (40%), I therefore added a test again.
{
  "$schema": "https://developer.microsoft.com/json-schemas/sp/v2/column-formatting.schema.json",
  "elmType": "div",
  "children": [
    {
      "elmType": "div",
      "style": {
        "height": "32px",
        "border-radius": "16px",
        "fill": "currentColor",
        "display": "=if (@currentField == '' , 'none', 'flex')",
        "overflow": "hidden",
        "padding": "0 8px",
        "justify-content": "center",
        "align-items": "center",
        "opacity": "= if(Number( (substring(@currentField,0,4)-getYear(@now)+4)*12+Number(substring(@currentField,5,7))) / (4*12+12) < 0.4,0.4,Number( (substring(@currentField,0,4)-getYear(@now)+4)*12+Number(substring(@currentField,5,7))) / (4*12+12) )"
      },
      "attributes": {
        "class": "ms-bgColor-themePrimary ms-fontColor-white"
      },
      "children": [
        {
          "elmType": "div",
          "txtContent": "@currentField"
        }
      ]
    }
  ]
}
Hopefully, this article will have given you some ideas for improving the fun in your own lists and libraries. Happy calculations!!!

Photo by Dan-Cristian Pădureț on Unsplash